| Longsplice |
 |
Investments |
Member
Navigation LinksTweet Advertisement |

Capital Markets Charts
Charts are updated when the data become available.
Click on any chart to see a version of it with higher-contrast colors:


If, a year ago, you had converted some money into the corresponding foreign currencies and bought a selection of foreign stock indices, your return to date (converted back into dollars) would be: 
If, a year ago, six overseas investors had converted some money into dollars and bought the US S&P 500 stock index, their return to date (converted back into their home currencies) would be: 
Longsplice Investments charts may be reproduced and redistributed in any print or electronic form provided that each chart is unmodified and "www.LongspliceInvest.com" on each chart is legible. Use on any medium that supports hypertext links (for example, the web) must include a link to "www.LongspliceInvest.com". Courtesy of Kitco: 
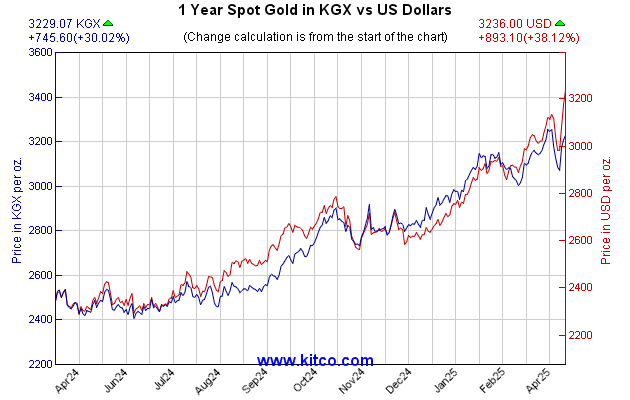
Kitco set up a nice way to see how much of gold's price movement is actually due to gold rising against all currencies, as contrasted with gold price changes that are really dollar strengthening or weakening relative to other currencies. Their KGX index shows the price of gold denominated in a basket index of major non-dollar currencies. For example, if gold priced in KGX is rising faster than gold in dollars, that means gold is truly rising, but the dollar is rising somewhat relative to the currency basket.
|
Friends and Partners

Fund Literacy, Care for the Environment, and get a Fair Price on the Books you Want. 

Advertisement |
Advertisement |